By Linda Riquelme.
Since its inception in 2006, the Atlas of Living Australia has become the most comprehensive public access point for information about all living things on land and in water in the Australian region. While there are areas that may be lacking data, the Atlas team is constantly working with data providers to obtain more data. And, of course, your help in filling the gaps in the Atlas would be greatly appreciated!
I have had the privilege of spending my summer with the team at the Atlas of Living Australia at CSIRO in Canberra. As the work experience person, I am responsible for the coffee runs.
Just joking!
My main priority has been to work with Lee Belbin to create layouts for more comprehensive area reports. The Area Report tool (Tools | Area Report) is an invaluable part of the Spatial Portal, allowing users to obtain a summary of biologically-related data in a specific area.

For example, a park manager can use the area report to quickly and easily get an idea of all the data available for a particular national park. By going into the Spatial Portal, they can select the national park from the Collaborative Australian Protected Areas Database (CAPAD) layer, and then generate an area report.
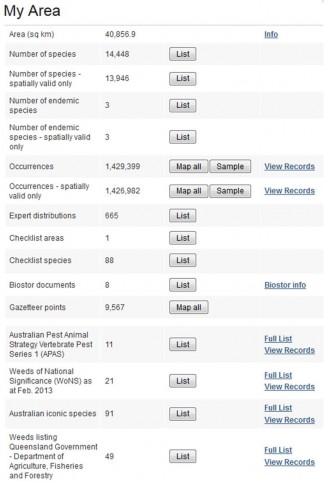
Currently, when an area report is generated, you are provided with information on area size, the number of species (including iconic, endemic and pest species), as well as other information like expert distributions (fig. 1).
Area reports can be used for research, park management, natural resource and catchment management, consulting (e.g. environmental impact assessments), and farm, local and state/territory government planning. Area reports also provide an opportunity to discover more about Australia’s biodiversity.
Information that we plan to add to the on-screen area report will include:
Dynamic land cover classes (terrestrial)
- IMCRA bioregions (marine)
- Species lists by lifeform
- Specimens with DNA sequences
- Migratory species lists
- Threatened species lists and classifications
In addition to the on-screen area report, a comprehensive area report in PDF format will be developed. This will collate everything that is known about an area into a single, downloadable PDF-formatted report. Features that will be included in the PDF report that won’t appear on the on-screen report include:
- Global context ecoregions: Terrestrial/Marine/Freshwater Ecoregions of the World (TEOW/MEOW/FEOW)
- Sensitive species lists
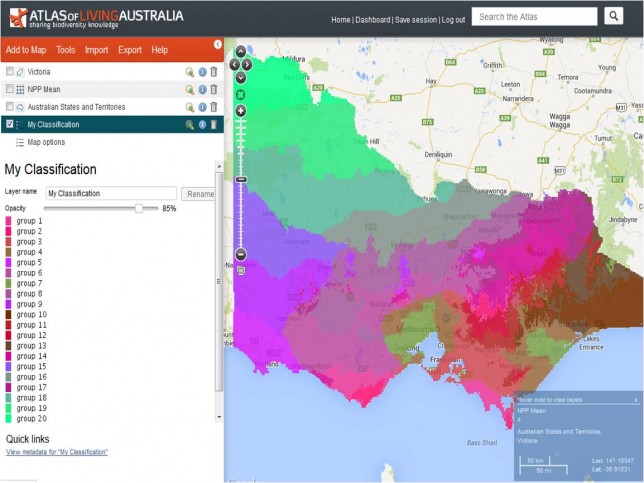
- Classification of area maps (fig.)
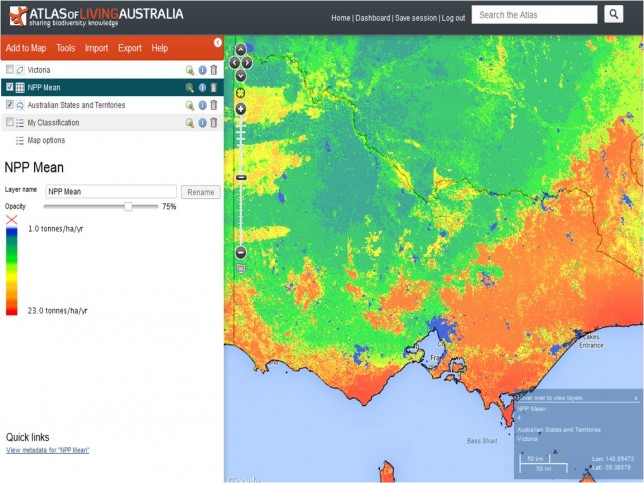
- Net Primary Productivity (NPP) maps (fig.)


The Atlas of Living Australia has just reached 1 billion downloads (and counting). With the enhanced area report, the Atlas of Living Australia can continue to provide biological and environmental information to assist in research, monitoring and the decision-making processes. The future of biodiversity information sharing looks bright!