By Lee Belbin, Geospatial Team Leader

Team member Adam Collins has developed two key applications for the Spatial Analysis Toolkit. The ALA’s emphasis is on species, but there is high value in integrating a range of environmental data. The first application samples the values of selected environmental data surfaces at the geographic locations of species observations. Sampling produces a spreadsheet file containing of locations (rows) by environmental values (columns).
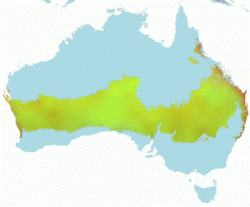
Adam is also developing a filtering application: The reverse of sampling. The user selects environmental layers of interest and lower/upper bound values for each layer. Filtering then identifies what species lie within the defined environmental envelope. The figure shows the areas in Australia with a single layer – a mean annual temperature between 17.4 and 21.7 degrees Celsius.
In the next newsletter, we will discuss the first modelling application in the Toolkit: MaxEnt.