The Area Report options generate a report for a selected region/area. There is a simpler interactive version and a detailed PDF area report that contains more detail.
- Note: The Detailed area report can take more than 10 minutes to generate. Please therefore be cautious about the size of the area you are reporting on. We will endevour to develop a faster method, but there is a lot of data to find, collate and report.
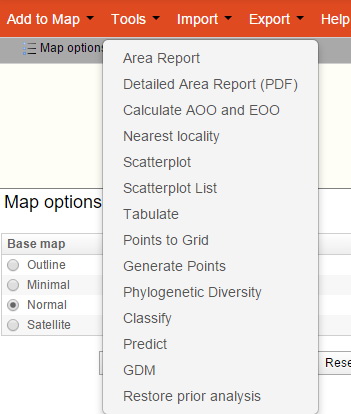
From the menu option, select “Tools” and then “Area Report” or “Detailed Area Report”.

Click the “Next” button. Note the “Define new area” involves an extra step to define the area of interest (please refer to Add Area for additional information).
Any predefined area listed as a map layer in the top left layer list can be used to for an Area Report.

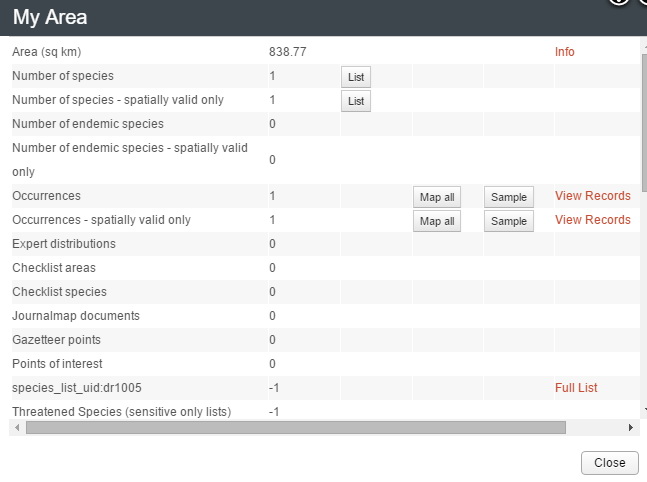
The following details then appear in the pop-up Area Report:
- Area (sq km): The area in square kilometers of the selected area. With an Info hyperlink to explain about the World Area bounding box we are using
- Number of species: A list of all unique species derived from the occurrence records for the area. Clicking on the List button will produce a species list. Note that only the ‘most-preferred’ common name (if any) will be listed for each species. The list can be downloaded in CSV format.
- Number of species – spatially valid only: This is a potential subset of (2) above without any species that have any type of flag questioning their location. For example, a record of a marine species on land (or vice versa) will be flagged.
- Number of endemic species: This list will contain those species that only occur within the area. The list can be downloaded in CSV format.
- Number of endemic species – spatially valid only: The same as (3) above except for endemic species.
- Occurrences: The number of point occurrence records for all species in the area (observations, specimens etc.). The Map all button will map all occurrences in the area (only available if the active area contains <= 2,000,000 occurrences). Sample button: Will start the process of sampling any of the user-selected environmental or contextual layers at the points. View Records: Will open a new window displaying all the details of the records in the area.
- Occurrences – spatially valid only: As for (3) and (5) above. Only those records that do not have have any spatially validity flags set.
- Expert distributions: The number of species for which we have expert-defined areas of their distributions that intersect the area of interest. List: Will list the species and some associated detail and allow for the polygon/s for individual species to be mapped. The list can be downloaded in CSV format.
- Checklist areas : “Checklists” are lists of species that are known to occur within a defined area that we call a “Checklist area”. The specific location of the species in the area is unknown, only that they are known to occur within that checklist area. List: Enables the checklist areas to be listed an optionally mapped.
- Checklist species: The number of species that have been assigned to Checklist areas that intersect the area. List: Will list the species that occur within the checklist areas. Any of the listed species can be mapped from this list.
- Journalmap documents: The number of documents in JournalMap that have a reference to an area that intersects the area of interest.
- Gazetteer points: The number of gazetteer locations from the 2010 Australian gazetteer. This option was added (among other reasons) to help identify ‘islands’ without formal names.
- Various Lists such as Migratory species, Threatened’ species (species that have any conservation status via IUCN, State/Territory or Federal agencies) – based on the Threatened lists in http://lists.ala.org.au, ‘Invasive’ species (species that have been deemed in any way invasive in any part of the Australian region) – based on the ‘Invasive’ lists in http://lists.ala.org.au
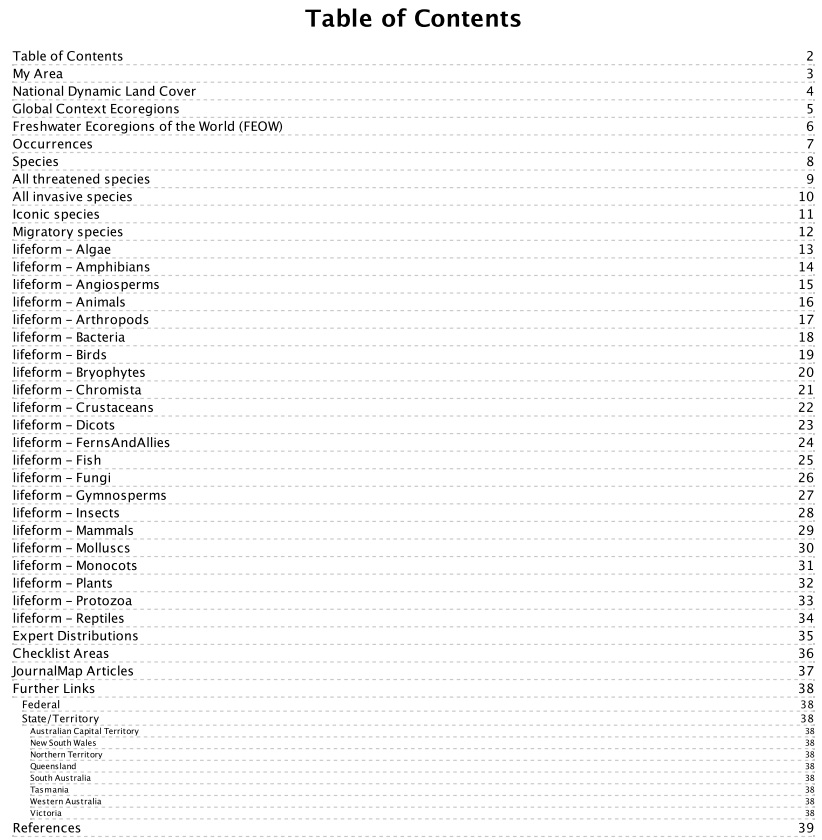
The Detailed Area Report (PDF) also contains for the area-
- Spatial context map
- Map of national Dynamic Land Cover
- Map of Global Terrestrial Ecoregions
- Map of Global Marine Ecoregions
- Map of Global Freshwater Ecoregions
- Further links
- References
—–Preliminary fields that may be included
- Points of interest: In MERIT (https://fieldcapture.ala.org.au/) a point of interest (POI) is a spatially referenced attribute of a site. It has a name, description, type, coordinate and bearing (optional). We currently only support one type of POI (ie. photo points), but the intent is also support other types such as: natural feature, cultural feature, works area, observation point/hide, trap site, etc. Photo points are a special kind of POI as, when they are associated with a site and that site is associated with an activity with a “photo point” output, images for the photo points can be recorded as part of the data collected for a record event.