Do you conduct research using Australian biodiversity data? Do you analyse data or make data visualisations?
ALA’s newest website, ALA Labs, is here to help. ALA Labs provides technical know-how and detailed solutions to specific scientific problems using data in the ALA.
Learn how with ALA Labs posts
The main showcase of ALA Labs is the Posts section. Posts are “how-to” articles on how to conduct specific statistical analyses or how to create data visualisations. Each post provides step-by-step commentary on how to do a specific task along with code so you can reproduce the analysis.
ALA Labs is managed by our Science and Decision Support team. Team members will share solutions to common problems for users, including those that they have used in their own work.
Solutions described in ALA Labs posts are not intended to be the “only” or “correct” way to solve a problem. Rather, each post offers one possible way to do or make something. The goal is to provide ALA users with working examples to implement in their own work, hopefully making everyone’s analyses and visualisations better!
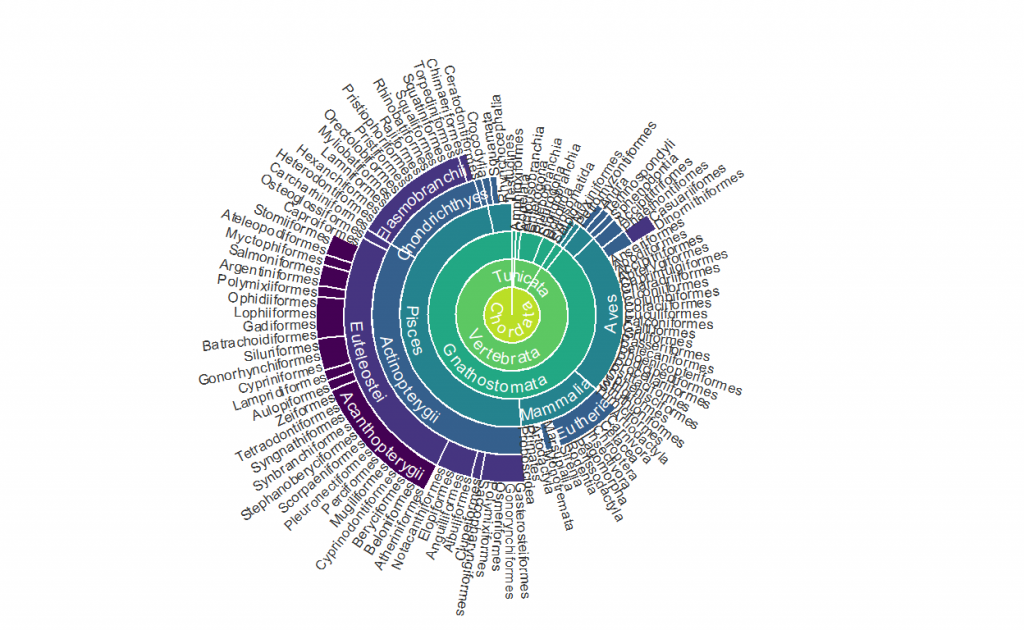
This visualisation of ALA’s taxonomy was created by Dr Martin Westgate in R using {galah} and {ggplot2}. The full details of how to recreate this analysis and visualisation are available on labs.ala.org.au.
“I always love hearing about the problems people are trying to solve using the biodiversity data in the ALA. We made ALA Labs to be a community space for people to share and learn about detailed solutions to data-related problems. I can’t wait to see how it grows,” said Dr Dax Kellie, evolutionary biologist, data analyst, and ALA Labs author.
R – the language of ALA Labs

So far, posts on ALA Labs offer coding solutions for users of R – a popular, free, open-access software for analysing and visualising data – and {galah} – the ALA’s R package to download information from the ALA. We intend to expand articles to explore other tools and coding languages in the near future.
We want to hear from you
Is there a statistical analysis you are wondering how to do in R? Would you like to make a new visualisation or map? Are you looking to use the {galah} package to filter and download information?
We would love to hear from you. Please send any suggestions for ALA Labs posts to support@ala.org.au.
Back to ALA Newsletter May 2022