New to the Atlas: PhyloLink Phylogenetic tool released
Posted on
The Atlas of Living Australia (ALA) has released PhyloLink – a new tool for visualising phylogenetic trees and exploring data from phylogenetic perspectives.
At the core of PhyloLink is the ability to intersect a phylogenetic tree with species occurrence records, environmental data and character information, resulting in the ability to generate flexible and customisable visualisations, profiles and metrics for biodiversity. The tools are intended for both novices and experts alike, and aims to make phylogenetic approaches to data exploration and visualisation accessible to a broad range of audiences.
A phylogeny (or a tree of life) is essentially a theory about how organisms are related to one another through evolutionary time. Phylogenies are based on the assumption that more closely related species will be more similar to one another, and they are commonly built using genetic sequences or physical characters. They are often visually represented as trees: the tips of the ever branching tree representing species, and the branches representing ‘evolutionary distance’ (e.g. length of time) from the ancestors from which they evolved.
The tool builds on PhyloJIVE and was developed as a collaborative project.
For a quick Youtube tutorial on how to use Phylolink click here.
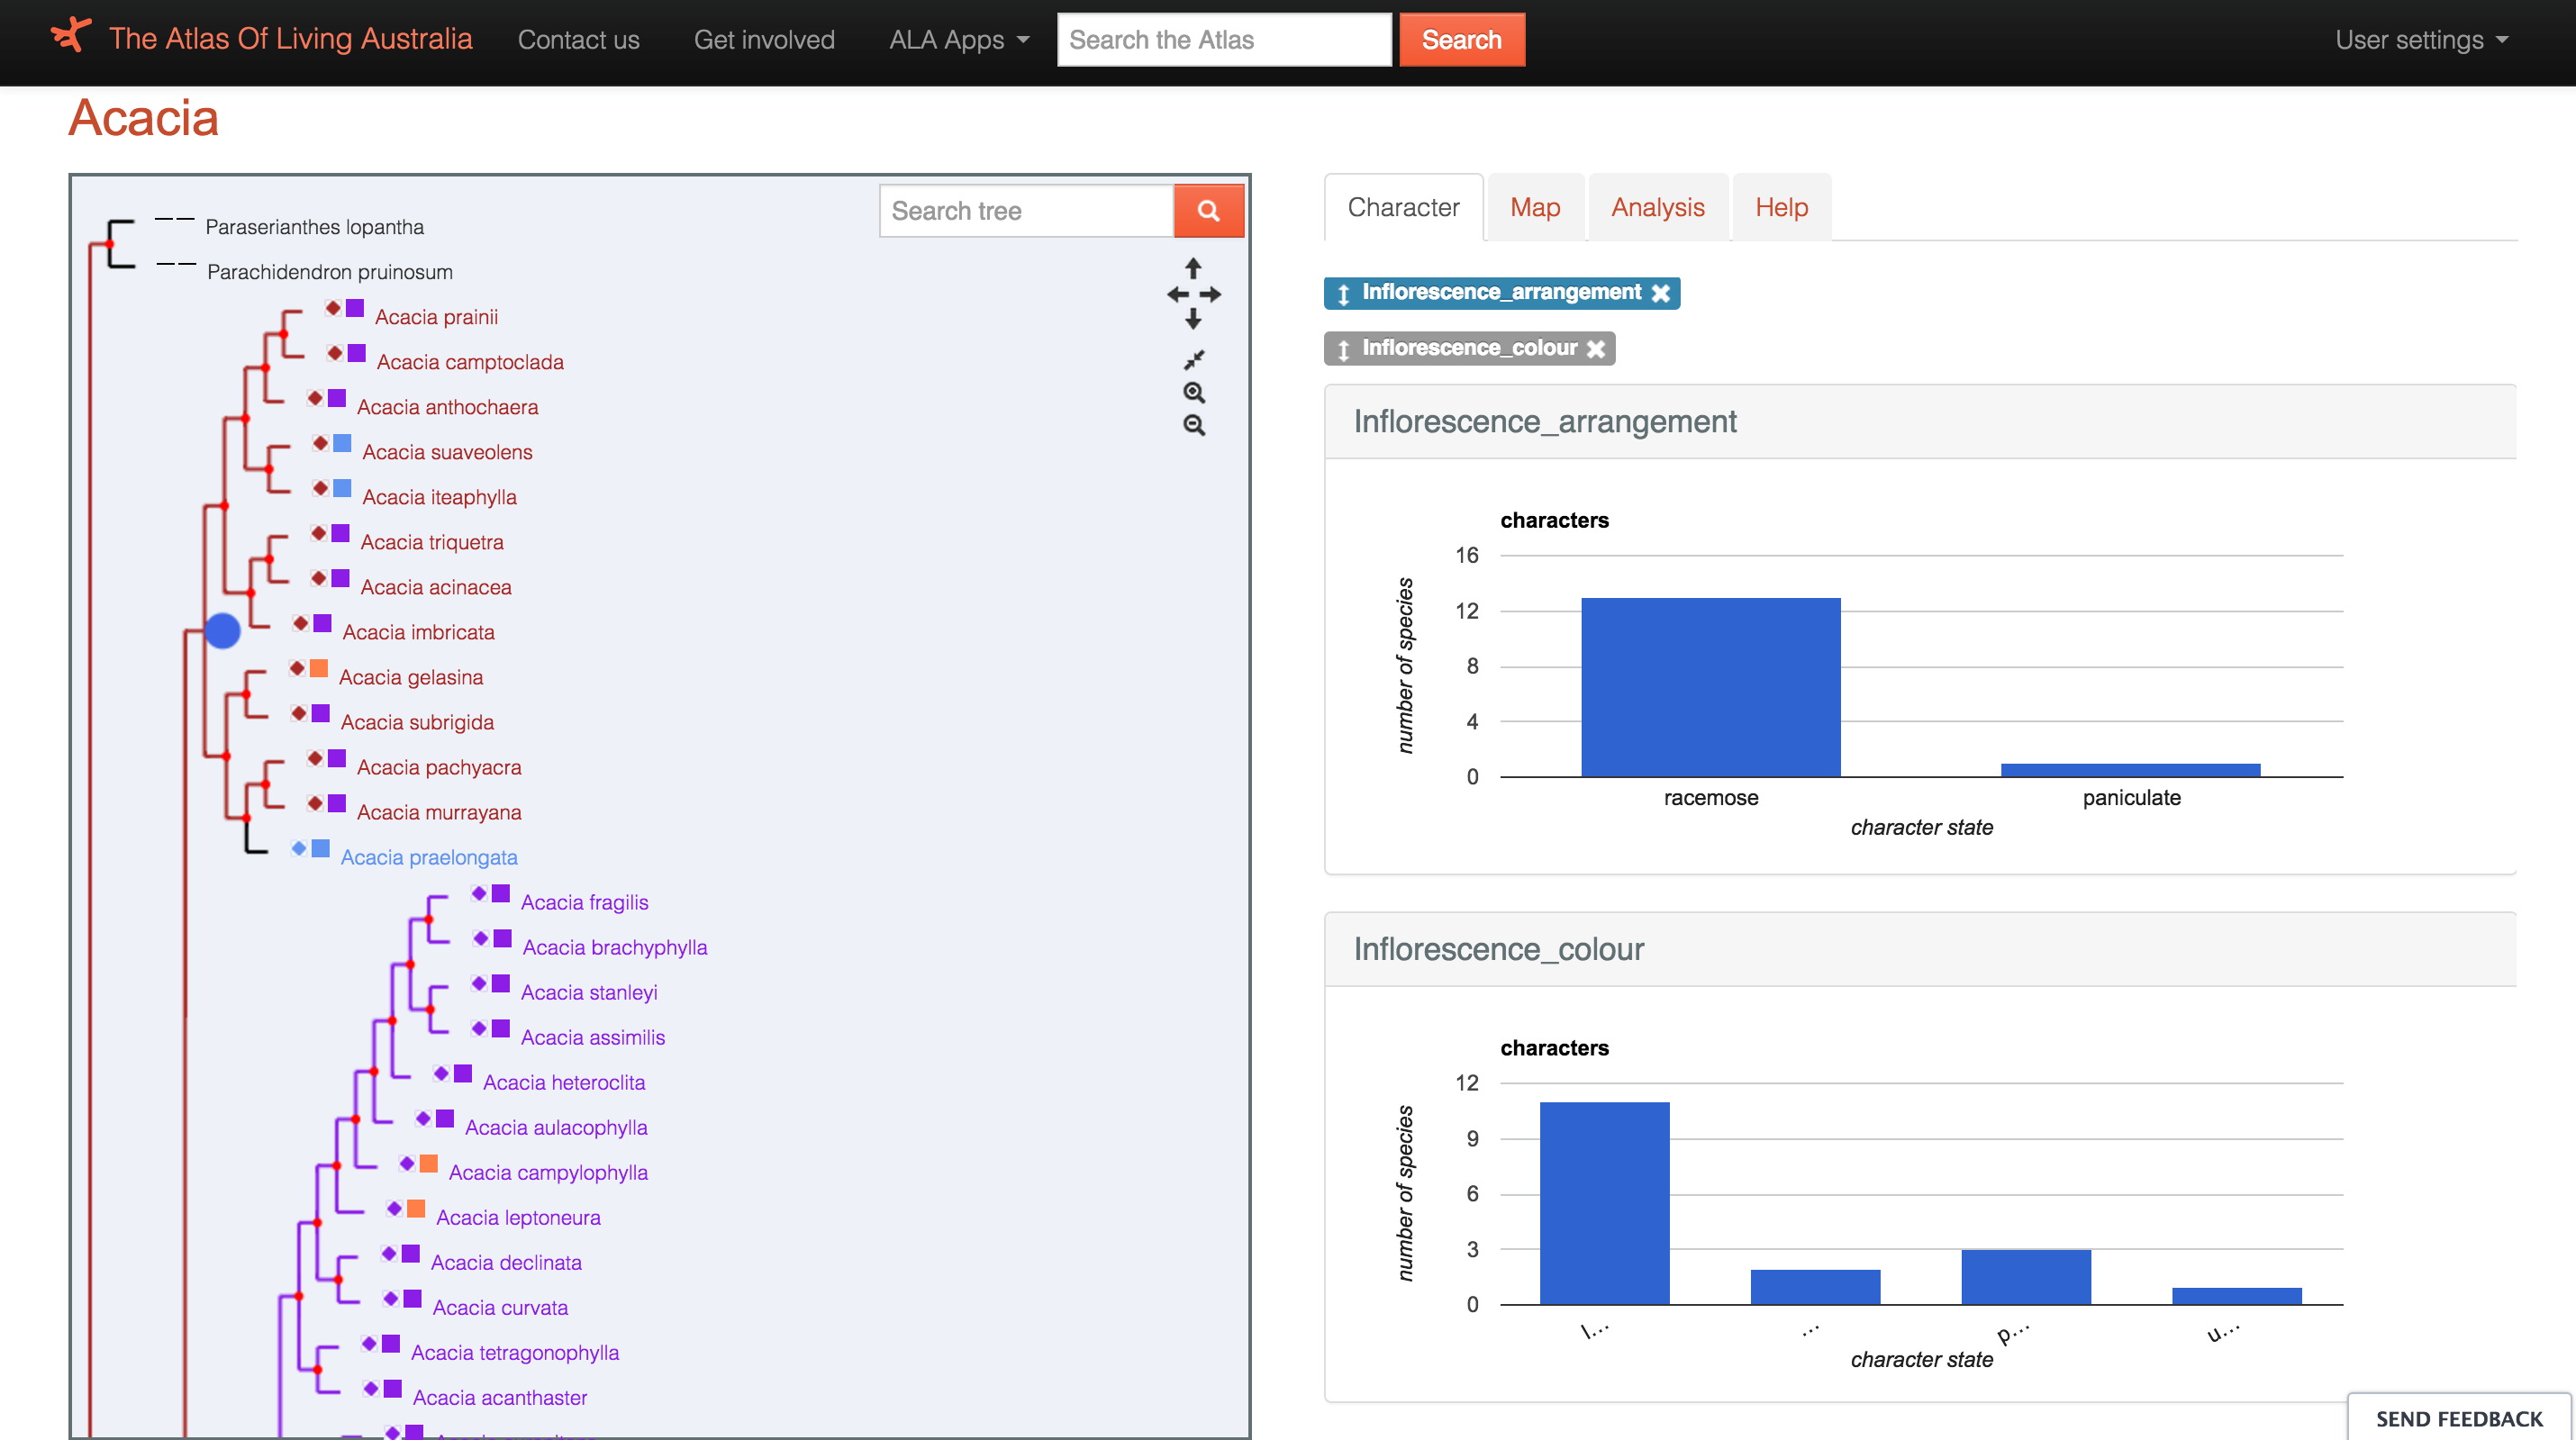
A phylogenetic tree for Acacia is mapped with characters (inflorescence arrangement and colour), and the prevalence of those characters in the selected clade is plotted.
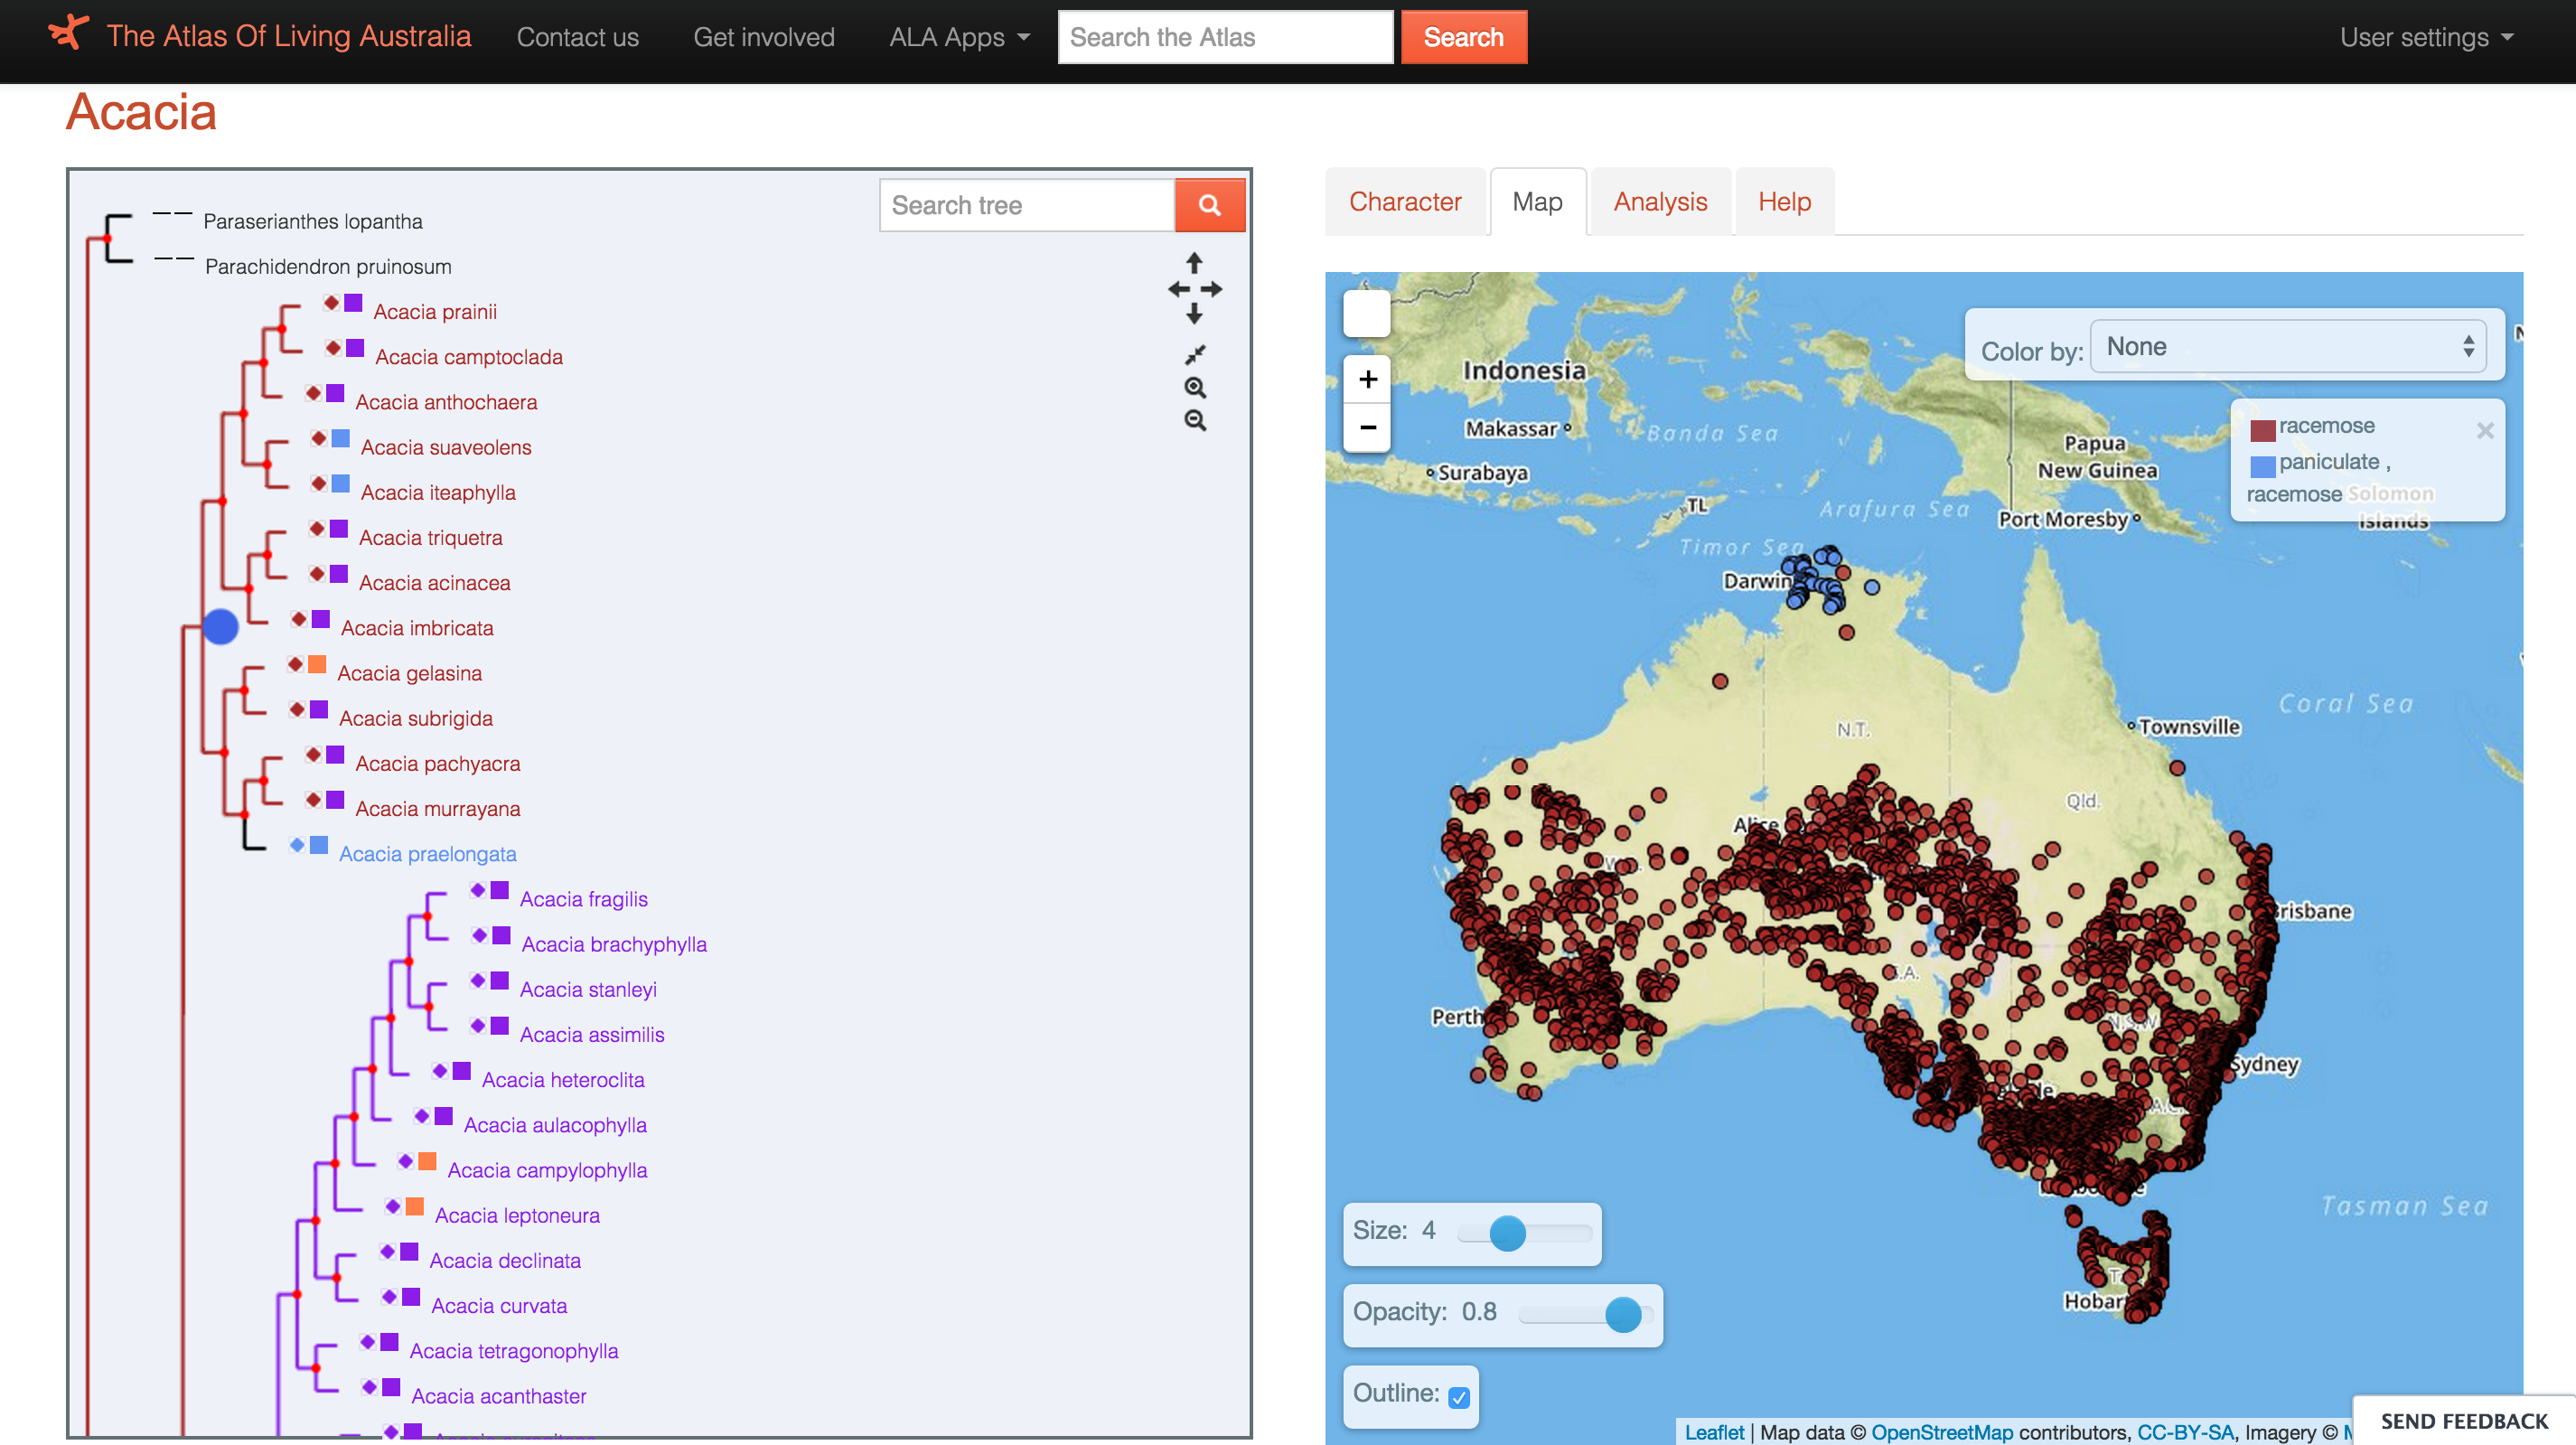
ALA’s new phylogenetic tools integrate phylogenetic trees and spatial mapping so that phylogenies can be represented spatially by, for example species occurrence or character. Here, the occurrence of Acacia species from the clade highlighted by the blue node is mapped and coloured by inflorescence arrangement.
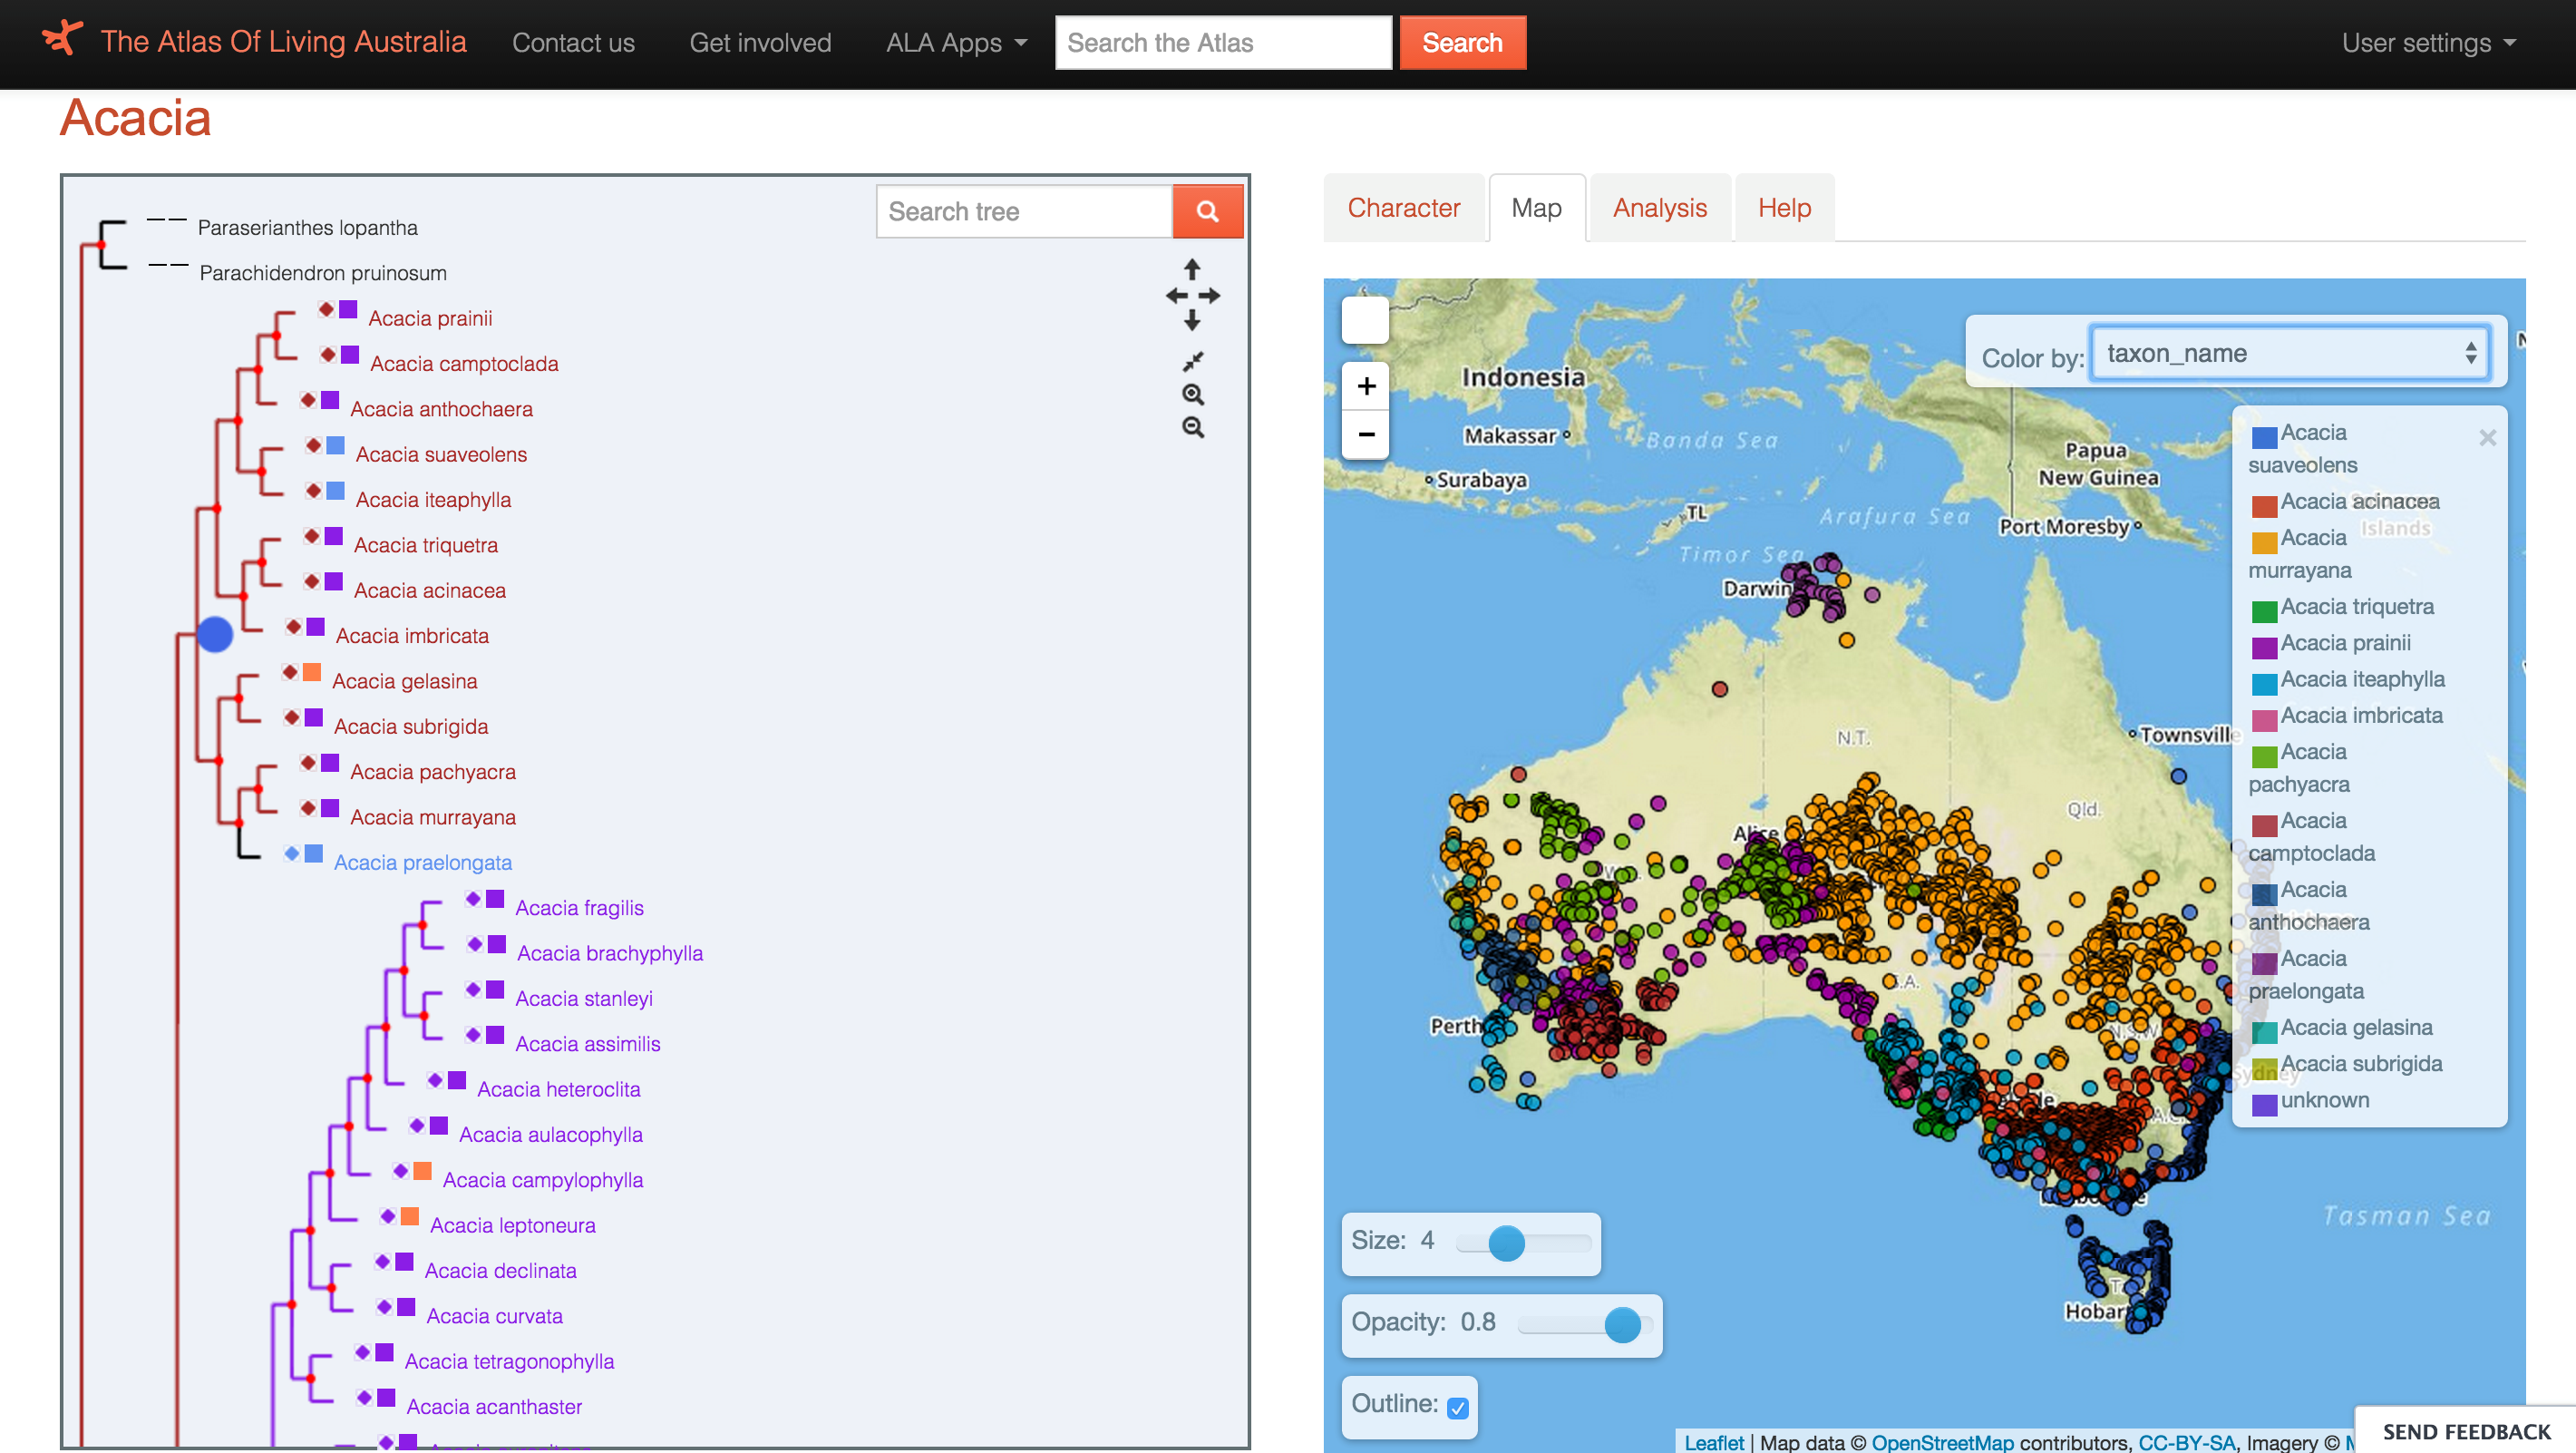
ALA’s new phylogenetic tools integrate phylogenetic trees and spatial mapping so that phylogenies can be represented spatially by, for example species occurrence or character. Here, the occurrence of Acacia species from the clade highlighted by the blue node is mapped and coloured by species.
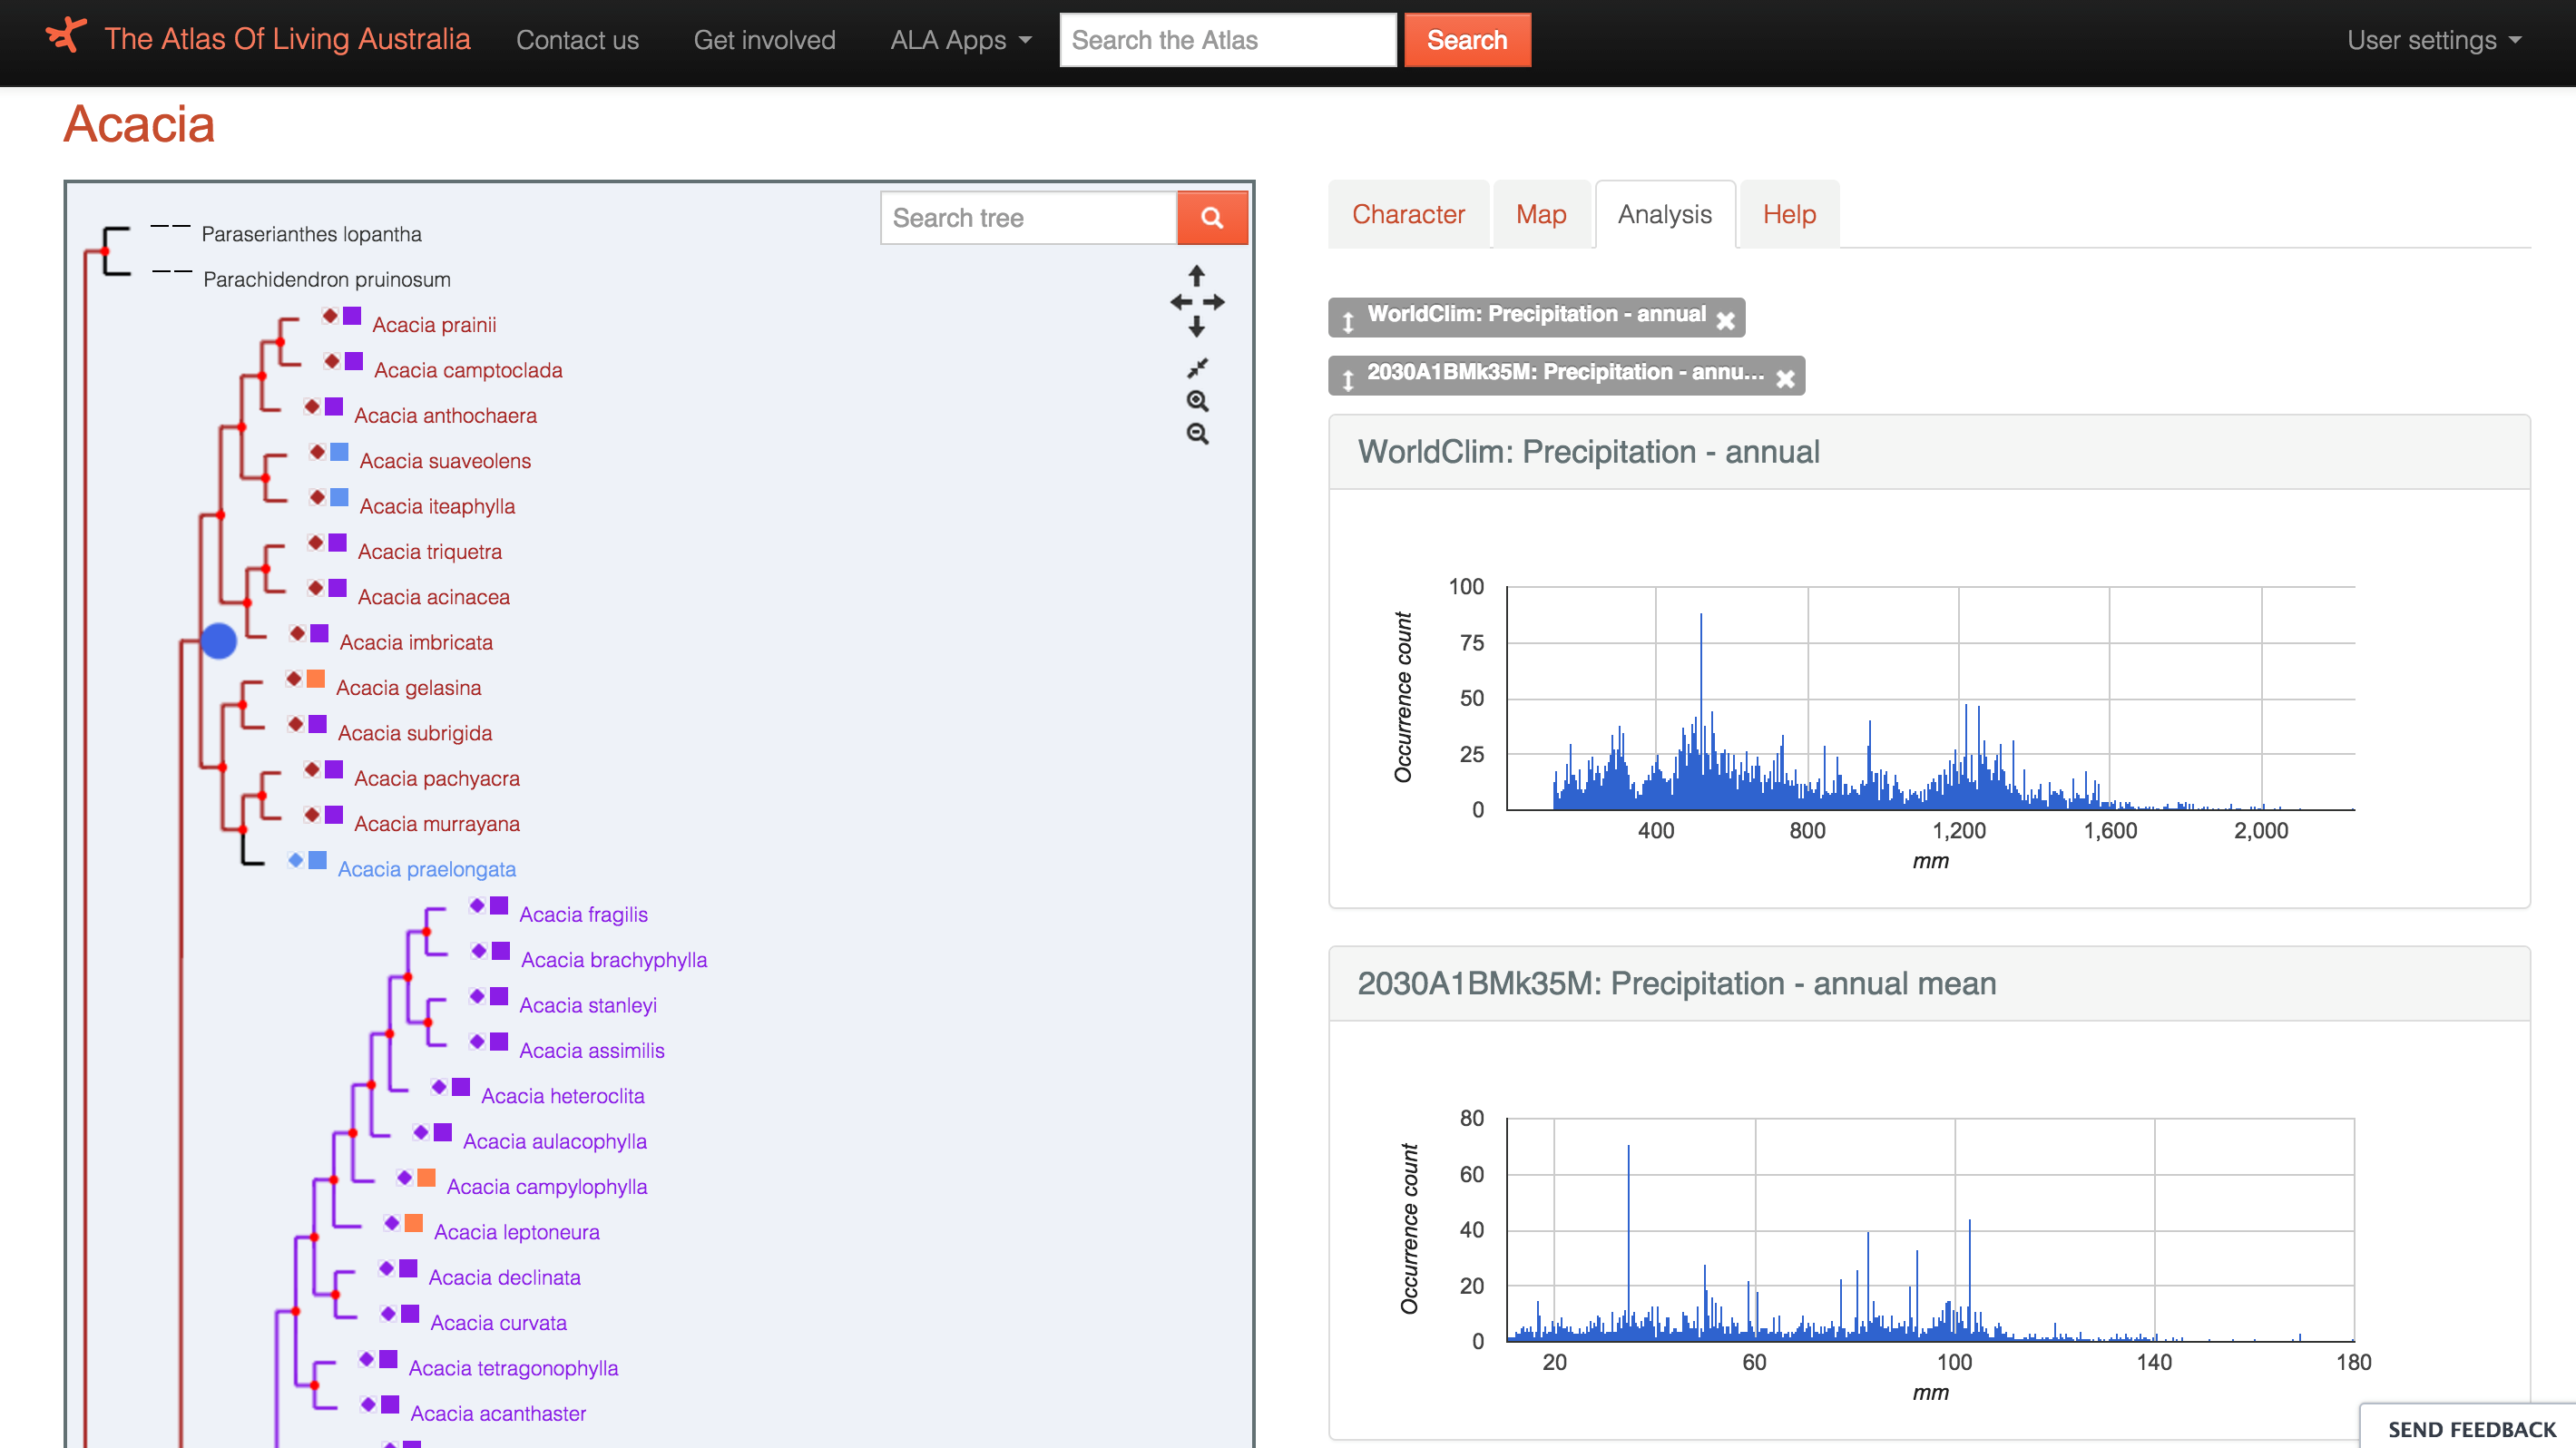
A phylogenetic tree showing the evolutionary relationships between Acacia species (left) is intersected with ALA Acacia records and precipitation layers to reveal the rainfall envelope occupied by a clade of Acacias. The envelope occupied at present (top right) can be compared to the envelope that would be occupied under 2030 predicted rainfall (bottom right).
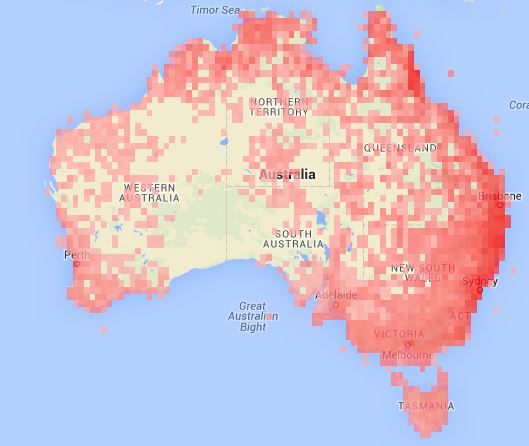
Phylogenetic Diversity (PD) of amphibians (grid cells 50x50km) with darker areas indicating higher PD. With ALA’s new tools PD can be assessed at a continental scale (as shown here), or compared between any number of user-defined areas, providing new options for exploring biodiversity patterns. (Map not corrected for patchy sampling. Source tree: Pyron RA, Wiens JJ. 2011. A large-scale phylogeny of Amphibia with over 2,800 species, and a revised classification of extant frogs, salamanders, and caecilians. Molecular Phylogenetics and Evolution 61: 543-583.)
Explore Phylolink at http://phylolink.ala.org.au/
Customise Your Experience
To best tailor your experience, please let us know
Which group do you associate with most?
Use the Customise Your Experience link at the top of the page to easily change your nominated user group at any time.