AOO and EOO
Area of Occupancy (AOO) and Extent of Occurrence (EOO) are two ‘statistics’ used by the IUCN for their Red List of Threatened Species (http://www.iucnredlist.org/). Their Red List of Categories and Criteria (IUCN 2012) defines these terms as follows-
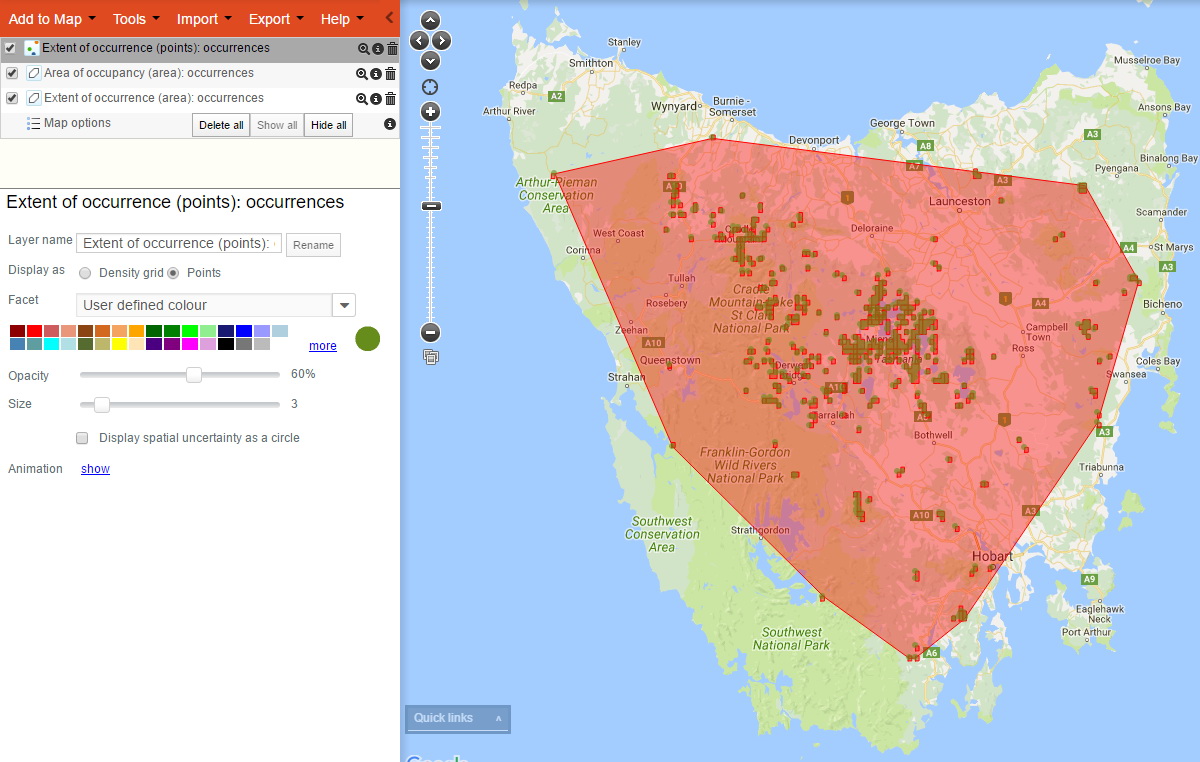
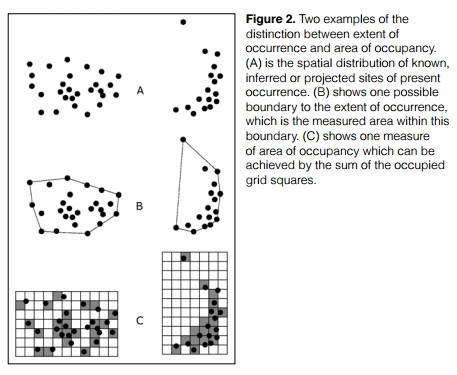
“Area of occupancy [AOO] is defined as the area within its ‘extent of occurrence’ which is occupied by a taxon, excluding cases of vagrancy. The measure reflects the fact that a taxon will not usually occur throughout the area of its extent of occurrence, which may contain unsuitable or unoccupied habitats. In some cases (e.g. irreplaceable colonial nesting sites, crucial feeding sites for migratory taxa) the area of occupancy is the smallest area essential at any stage to the survival of existing populations of a taxon. The size of the area of occupancy will be a function of the scale at which it is measured…” See Figure 2 IUCN 2012 below. The IUCN recommendation for the grid size used to calculate AOO is 2km but is user-defineable This grid is placed over all selected taxon records within the user-defined area.
Extent of occurrence [EOO] is defined as the area contained within the shortest continuous imaginary boundary which can be drawn to encompass all the known, inferred or projected sites of present occurrence of a taxon, excluding cases of vagrancy (see below Figure 2 IUCN 2012). This measure may exclude discontinuities or disjunctions within the overall distributions of taxa (e.g. large areas of obviously unsuitable habitat)… Extent of occurrence can often be measured by a minimum convex polygon (the smallest polygon in which no internal angle exceeds 180 degrees and which contains all the sites of occurrence). In the Spatial Portal, EOO is calculated as the minimum convex hull based on the “presence” taxon occurrence records within the user-defined area.
AOO and EOO would normally be calculated on taxa that have some ‘conservation sensitivity’. The ALA uses the term “Threatened” for any level or class of conservation status via the States, Territories, Federal Government or IUCN. Any species that is deemed ‘sensitive’ in having some State/Territory or Federal conservation status will be processed through the Sensitive Data Service (SDS: http://www.ala.org.au/faq/data-sensitivity/). The Sensitive Data Service may have changed the location of taxa that have a sensitive status. It is therefore wise to
- Map the taxa,
- Examine online or download the records to identify any data sensitivity, record fields and particularly, any assertions
- Filter these records in the Spatial Portal (see how to use faceting and filtering) to create the desired subset
- Run the tool on the new filtered taxa layer
The tool requests
- The area to be used as a bounding area for the calculation of AOO and EOO
- The taxa to be used (this can be a species list)
- The grid size to be used for AOO (default 2km)
The outputs are
- The number of records used for the calculations
- The taxa used
- Area of Occupancy (AOO: sq.km)
- Extent of Occurrence (EOO: sq.km)
- New point layer of the taxa occurrence
- New area layer: AOO
- New area layer: EOO (the minimum convex hull)
The statistics are downloaded automatically to your system as a text file and named as “Calculated AOO and EOO.txt”
NOTE: We hope that ‘full spatial resolution’ records will be able to be made available for this analysis in the near future, but mapping high-resolution data would be disabled, except for authorised users.
Generating Co-occurence/Co-location lists
Tools | AOO and Tools | Area report can be used as an efficient way of generating lists of species are co-located (co-occur) with a target species or species list. For example, to identify which species co-occur with say within 1km of occurrences of Casuarina obesa in Westerna Australia, go through the following steps
- Ad to map | species | Casuarina obesa
- Zoom and pan to the area of interest, in this case, Western Australian records
- Tools | AOO and EOO | Area=current extent | Casuarina obesa | 0.01 (~1km)
- Tools | Area report | Area of occupancy (area): Casuarina obesa
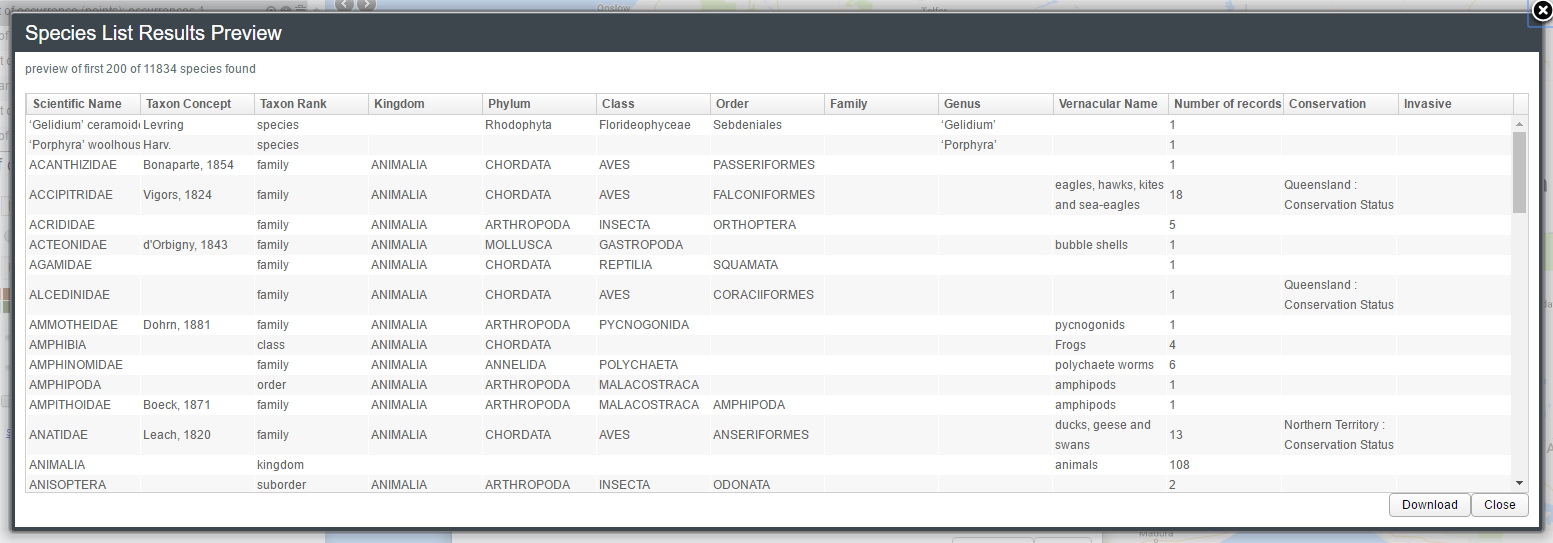
- In the Area report pop-up window, click on List button next to “Number of species – spatially valid only”
- In new pop-up, press the Next button as the defaults should be correct
- A table of species is produced and this can be downloaded as a CSV file by pressing the Download button
References
IUCN (2012). IUCN Red List Categories and Criteria: Version 3.1. Second edition. Gland, Switzerland and Cambridge, UK: IUCN. iv + 32pp. http://jr.iucnredlist.org/documents/redlist_cats_crit_en.pdf
Joppa, L. N., Butchart, S. H. M., Hoffmann, M., Bachman, S. P., Akçakaya, H. R., Moat, J. F., Böhm, M., Holland, R. A., Newton, A., Polidoro, B. and Hughes, A. (2016), Impact of alternative metrics on estimates of extent of occurrence for extinction risk assessment. Conservation Biology, 30: 362–370. doi:10.1111/cobi.12591 [” We conclude that a single, relatively resolutionindependent measure to calculate EOO (MCP)—as recommended by current IUCN Red List guidelines— will allow for assessments across species and taxonomic groups to be comparable over space and time and will ensure far greater consistency across the IUCN Red List.”]
R CRAN package for generating AOO, EOO, MBP etc for IUCN stats: https://cran.r-project.org/web/packages/rCAT/index.html