A few months ago, John Tann posted a blog on how to use the sandbox with a list of names.
This blog will focus on point data you would like to use within the Atlas. The sandbox handles species occurrence data but can also be used to upload a list coordinates (latitude, longitude) with any number of ad-hoc properties associated with these data. Scientific names or common names are optional.
As an example, heres a dataset that we’ve uploaded for termite mounds recorded by Peter Neville on Black Mountain, ACT. This dataset includes 17 additional properties that are not in standard use within the Atlas. The sandbox will support the facetting with all 17 of these properties, and in addition intersect the coordinates with environmental and contextual layers (IBRA regions, states, local government areas). The raw data can be found here.
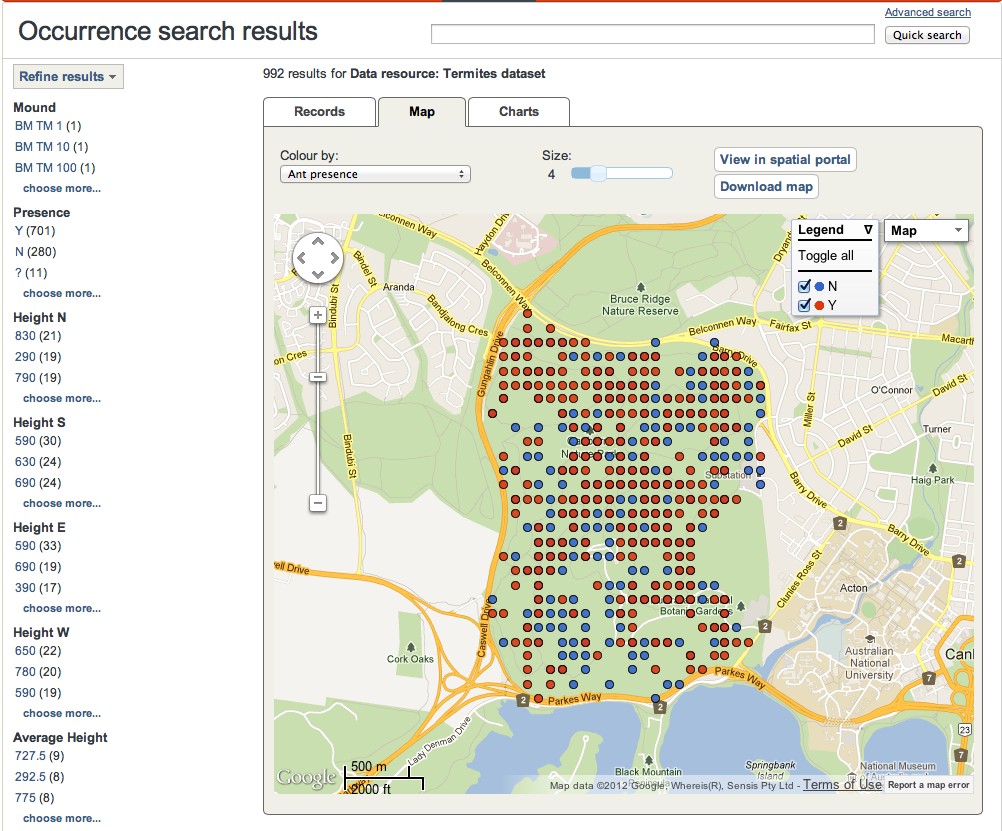
Once the data is uploaded, you can manipulate the data using search facets, and colour point data using custom facets:

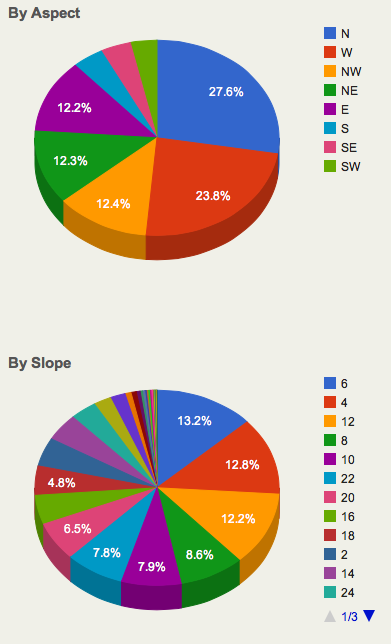
View charts for your data, with breakdowns by the custom fields in your dataset:

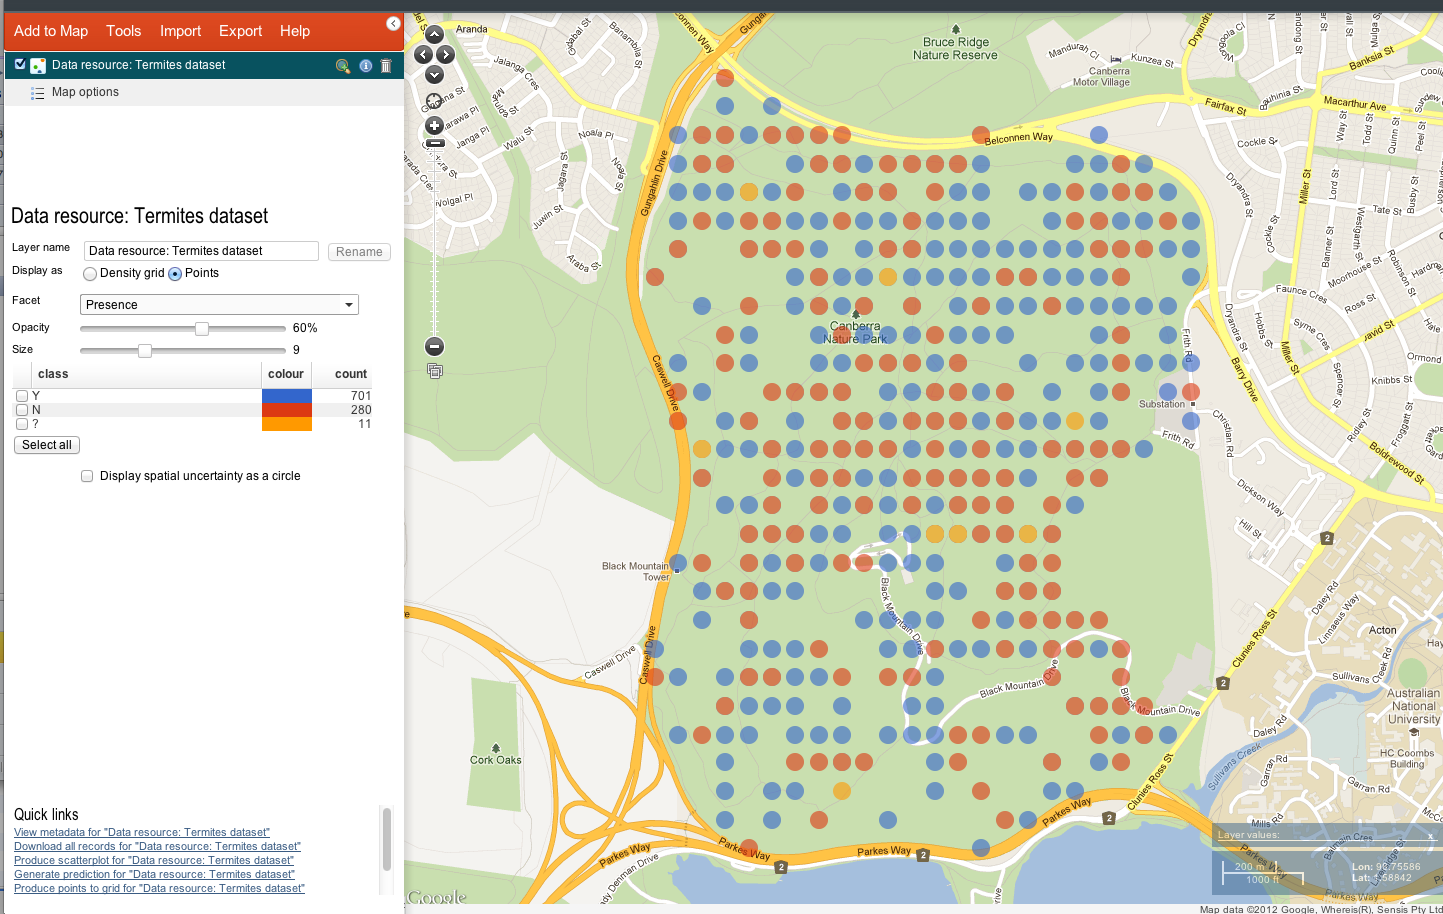
And also make use of these facets in the spatial portal.

Within the spatial portal, the custom facets can be used to generate layers from subsets of the data in the same way it can with the standard facets (e.g. occurrence date, scientific name, LGA, states) for species occurrence data.
How to use it with your data
1. Visit http://sandbox.ala.org.au, and paste in your data into the text field at the top of this page..

2. Check how the sandbox has parsed your data. The sandbox will try to work out if the first line of the data are column headings or data. If it gets it wrong, you can change the interpretation of the first line of your data using the select box.
Fields headings with a yellow background are fields not recognised as standard Atlas fields. Facets will be created for these non-standard fields provided the data within these fields is below 50 characters in length. You can adjust these headings at this stage and hit the Reprocess sample button.

3. Upload the data. Uploading and processing of your data may take up to 2 minutes. During this processing, the sandbox does the following:
- Attempts to match the classification in the records to the National Species Lists.
- Reverse geocodes points to states, IBRA, IMCRA regions
- Sensitive data checks
- Data quality checks
Once this has finished, you should see the following options:

Here are the options from here:
- “Mapping & Analysis with your data” will take you to the Spatial portal.
- “Tables & Charts of your data” will give you a tabulated view of your data, and charts you can use to subset the data.
- “Download the processed version of your data” will give you a ZIP download of the data with interpreted values.
Feedback & suggestions
Feedback and suggestions for further functionality for the sandbox are welcome.